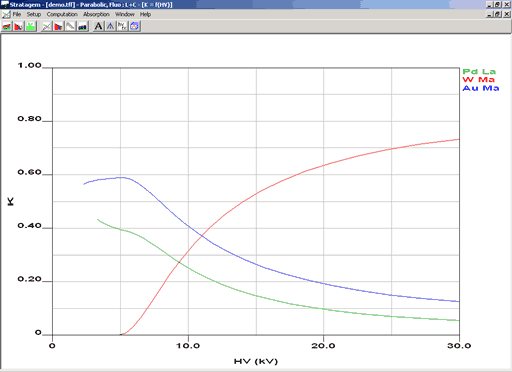
Display of the relative Intensities versus the accelerating voltage.
Theoretical curves, Experimental points, Comparisons, Text.

Theoretical Curves
· For each accelerating voltage step, STRATAGem calculates the corresponding relative intensity in the sample configuration (number and composition of layers).
· The fluorescence option can be either enable or disable.
Experimental data and Text
· The Experimental relative intensities are displayed also on the graph. This allows the user to compare the data to the theoretical computation.
· A cursor can displayed the intensities of all elements. A text mode, allows the user to add his own comments on top of the graphic area.
Simulations
· This type of graphic without any experimental data can also be used and therefore allows the user to simulate more or less complex sample structure in order to better choose the experimental conditions of the measurements.