Strata Automatic Iteration
Computation of unknown thicknesses and compositions.

Compositions and Thicknesses
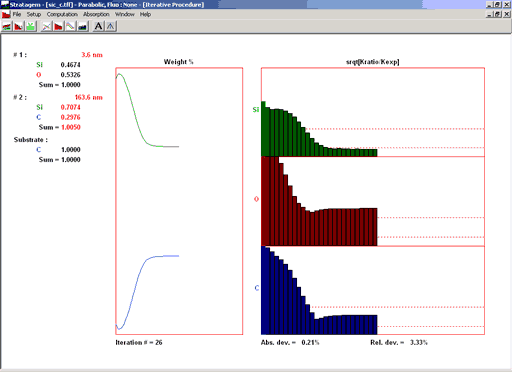
During the iteration procedure, here 26 iterations, the program displays at each iteration the compositions and thicknesses found. The sum of unormalized composition is also displayed
Graphic
· The left plot shows the history of the composition of each element.
· The right plot compares (ratio) the relatives intensities calculated to the one measured. Two horizontal bars at 1 and 10% allow the user to better understand the error. Two error values (relative and absolute) are calculated and displayed at the bottom of the window.